


Why Your Current Attribution
Is Lying to You
Last-click and platform-reported numbers misallocate 35-50% of your budget. Here's what it looks like.
Budget vs. Actual Revenue Contribution
 Meta
Meta Pinterest
Platform discrepancies don't discriminate by budget
- At $200K annual spend -> $70K-$100K misallocated
- At $500K annual spend -> $175K-$250K misallocated
- At $1M+ annual spend -> $350K-$500K+ misallocated
[Source: Skeldir analysis of 200+ ecommerce brands]
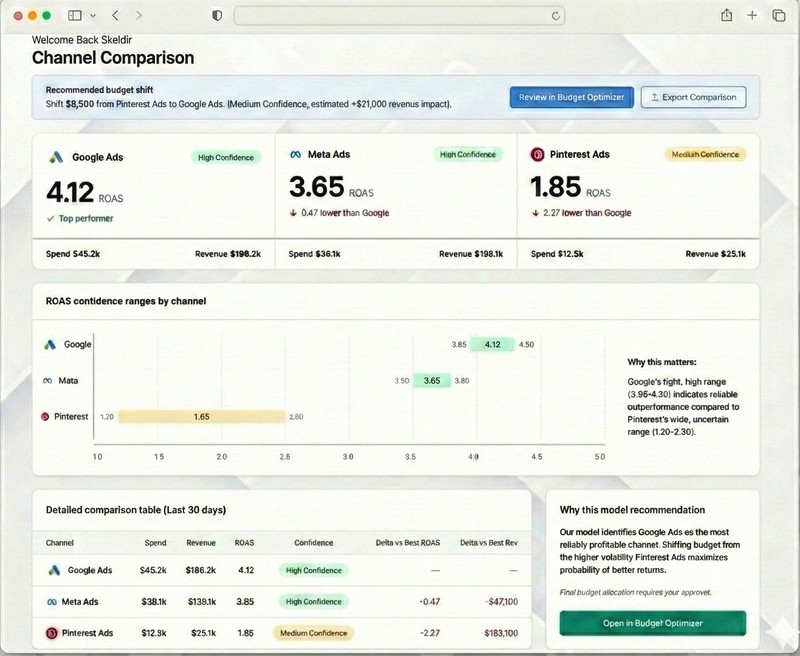
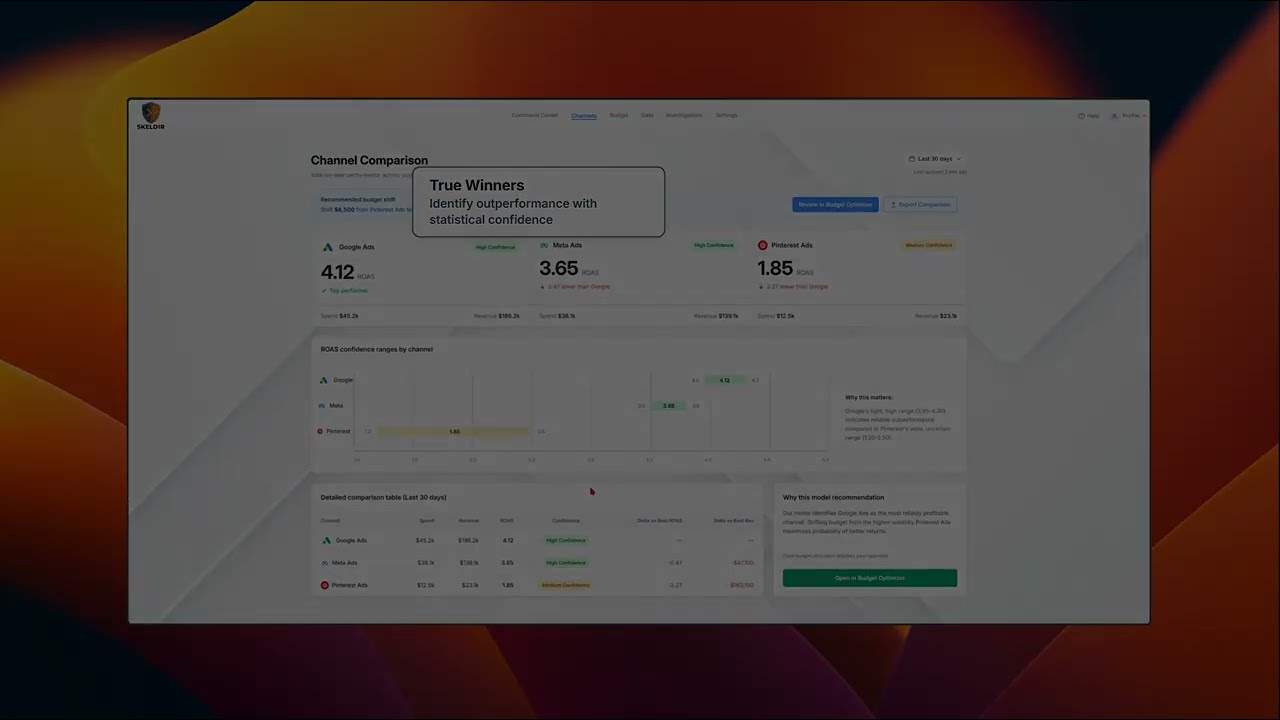
See Skeldir in Action
Explore a live dashboard
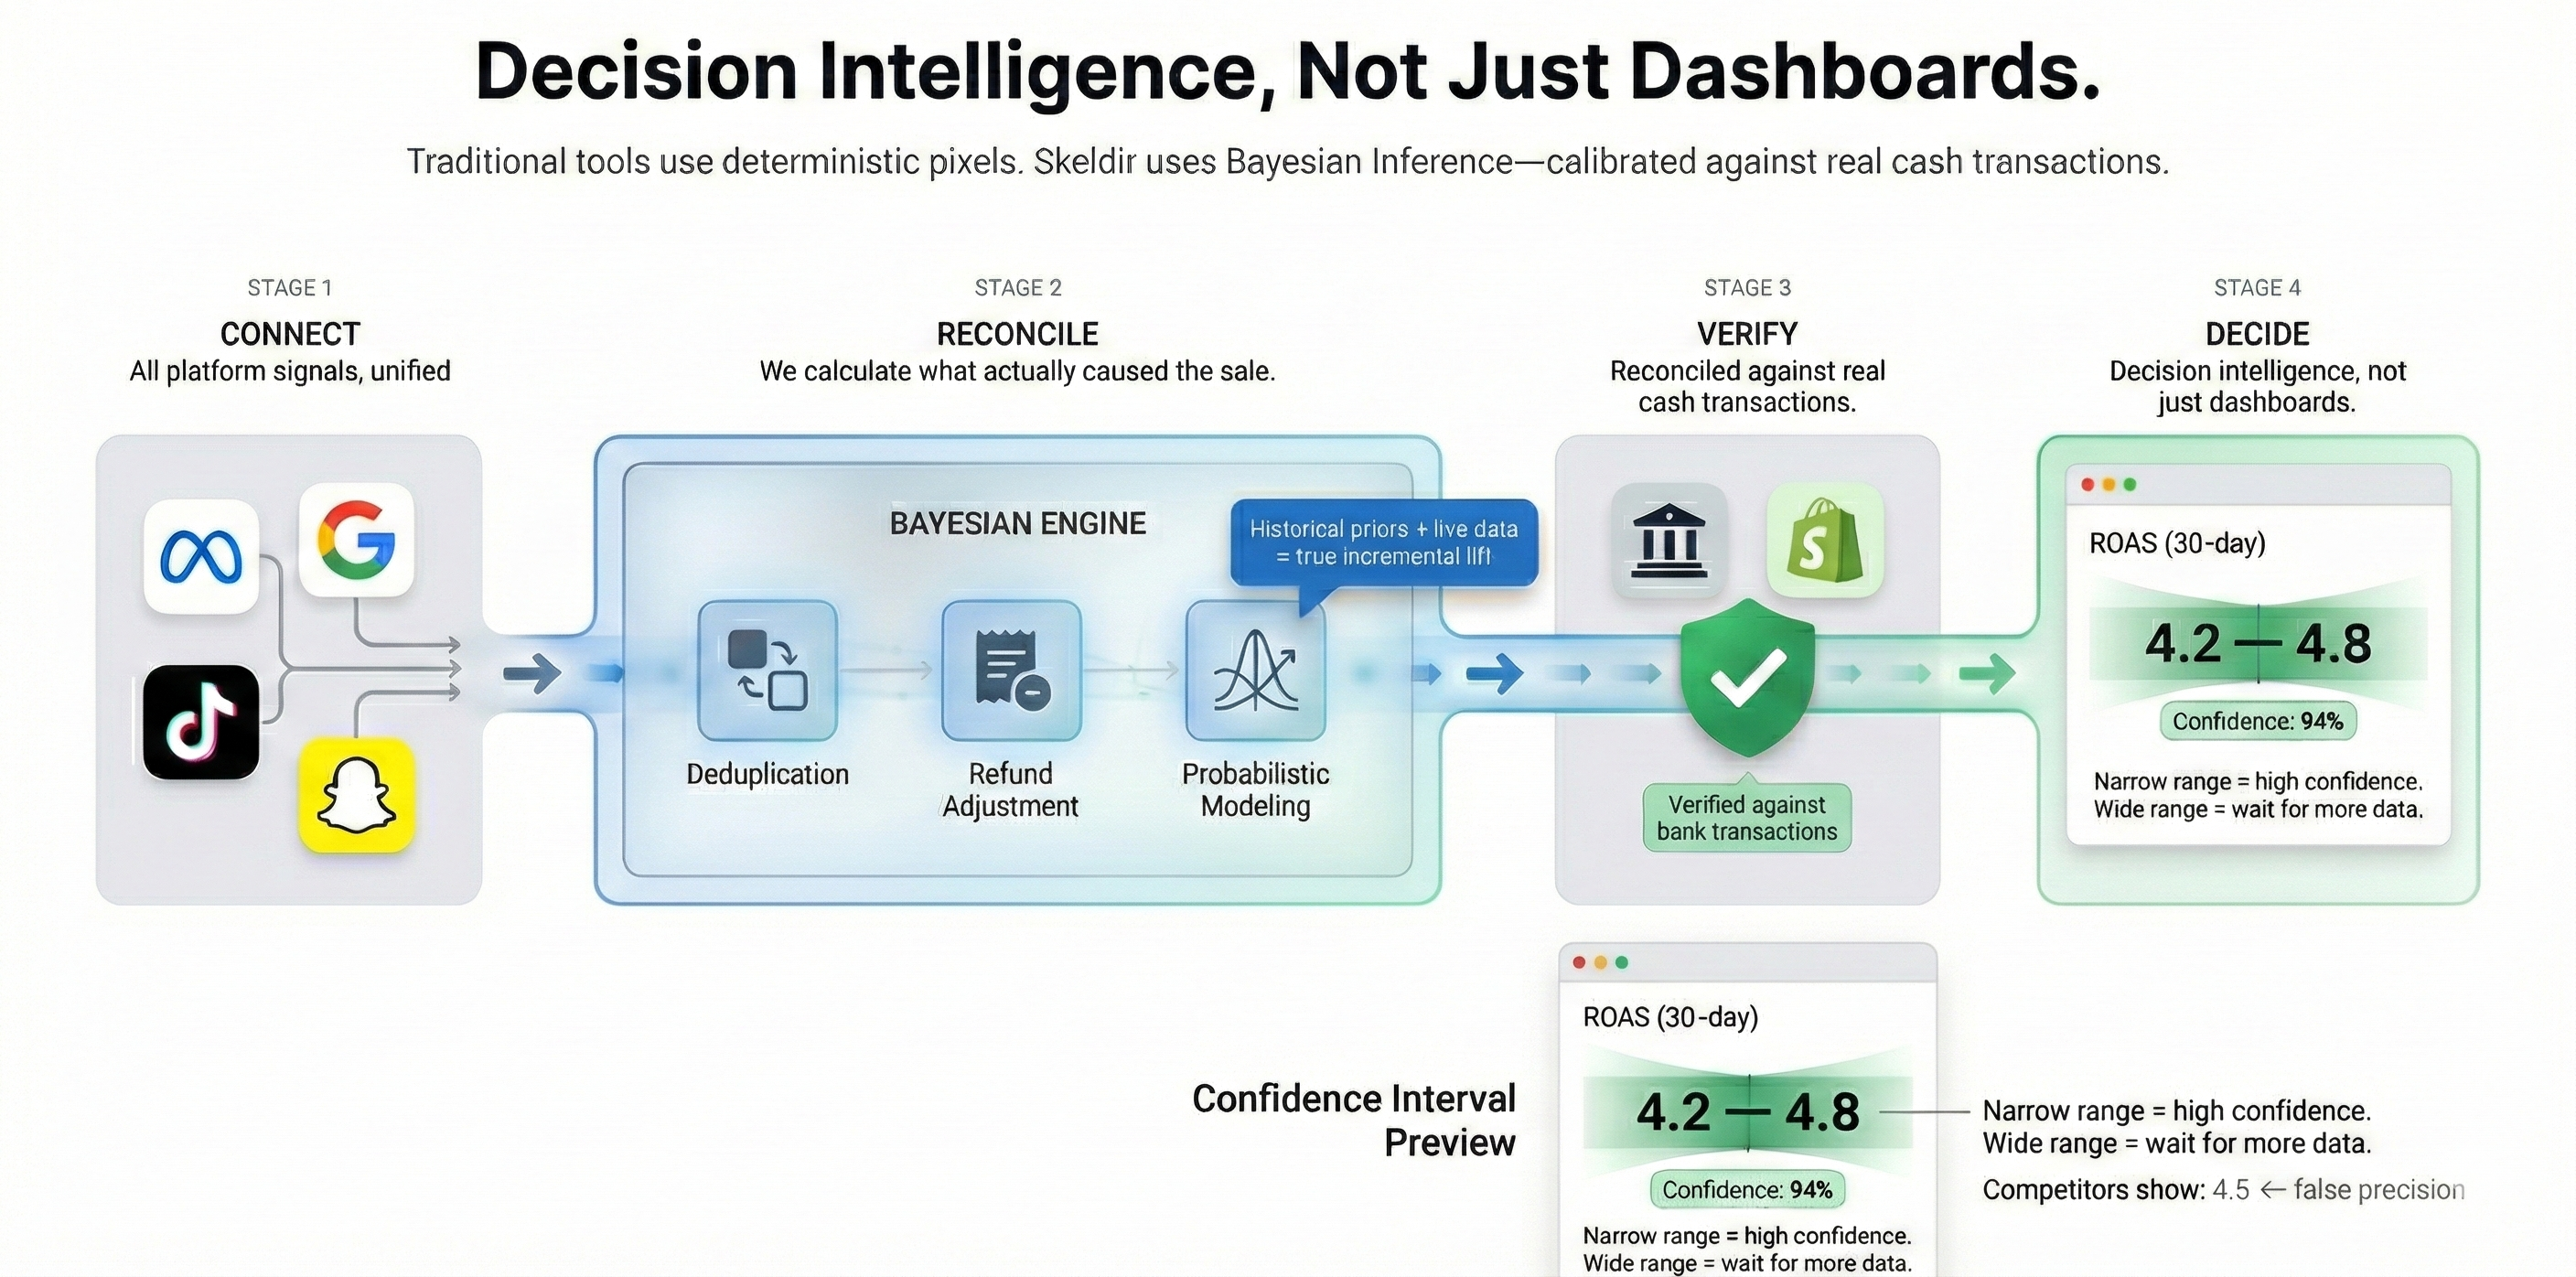
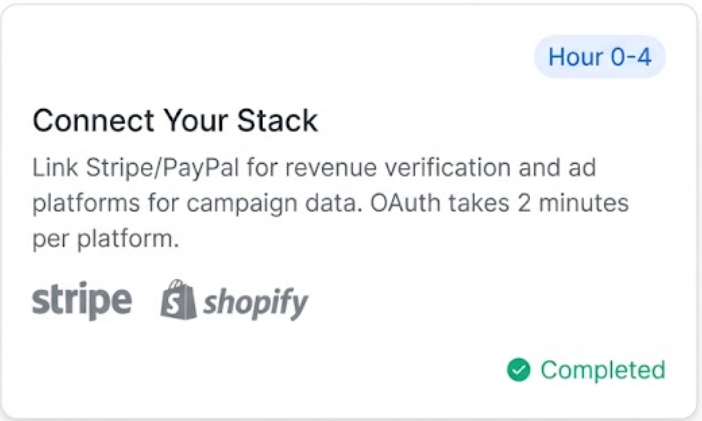
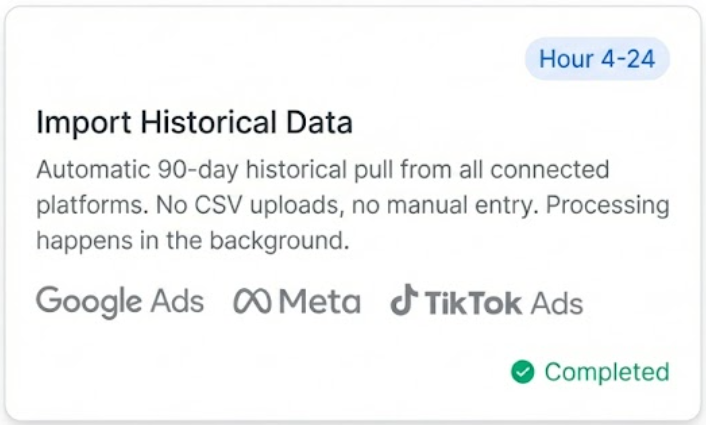
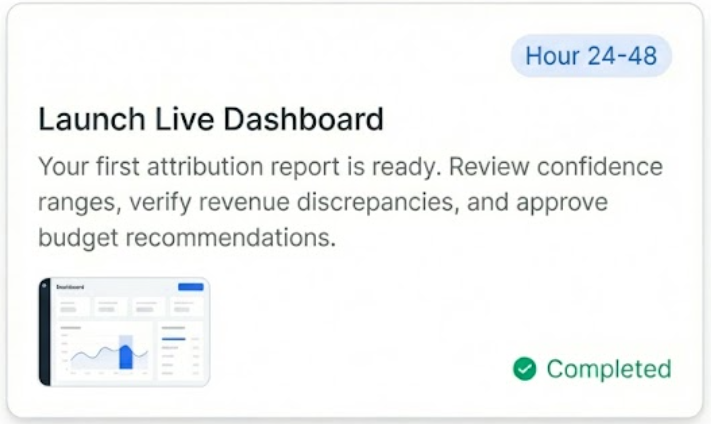
How It Works
Get the Truth
$149/month
Best for business owners who want to see what's really happening with their ad spend.
See real revenue next to what ad platforms report
Attribution across up to 3 ad platforms
Automatic reconciliation (no spreadsheets)
Live in 48 hours with self-serve setup
Standard email support included
AI-generated explanations that clarify why your numbers look the way they do
What this helps you do:
Spot inflated or misleading performance numbers
Stop making decisions based on bad data
Save 10–15 hours per week on reporting
Most popular
Optimize for Profit
$349/month
Perfect for owners and operators actively reallocating ad budget who value confidence before moving real dollars.
Everything in Tier 1, plus:
Connect all ad platforms (no limits)
See which results are reliable and which aren't
Test budget changes before spending real money
Clear guidance on where to increase or pull back spend
Priority support for active decision questions
Full Proprietary Intelligence models with reliability indicators across channels
AI-assisted budget analysis that explains tradeoffs and constraints
What this helps you do:
Reduce wasted ad spend
Move money with more confidence
Justify decisions with clear evidence
Run at Scale
$749/month
Specifically made for agencies or businesses managing multiple brands or accounts.
Everything in Tier 2, plus:
API access for integrations and automation
White-label reporting with your branding
Guaranteed response times and priority handling
Guaranteed response times and priority
Named account contact for coordination
Built for multi-account, business-critical use
AI-generated explanations designed and tailored for client-facing delivery
What this helps you do:
Reduce operational overhead
Standardize reporting across teams or clients
Rely on Skeldir as core infrastructure
See what our customers say
VantageCATALYSTApex AnalyticsMeridianNovus